Portfolio Changes & Economic Commentary for Q4 2022
Time to head for cover
Our last market update started with the following statement:
This was the worst first half of the year in more than 50 years. At the heart of this year’s stock market slump is the increasingly hawkish monetary policy employed by the Fed and other central banks. The Federal Reserve hiked interest rates by 75 basis points in June. Chair Powell signaled fighting inflation is the central bank’s top priority, and that the path to a “soft landing” may be challenging.
While we were writing this piece, the Fed raised interest rates another 75 basis points (a basis point is just finance speak for 0.01% because in our view the industry relies on jargon to confuse people). In an effort to reduce inflation down to their target rate of 2%, the Federal Reserve has already implemented four interest rate hikes in 2022, including two consecutive “jumbo” rate hikes of 0.75% in June and July. The federal funds rate is currently 3% to 3.25%, but in his closing remarks, Jerome Powell, signalled that the Fed now thinks it will have to raise rates to the 4.5-5% range. This represents one of the most aggressive interest rate increases in recent history (more on this later) and we believe for a number of reasons (see the section on stats & charts for nerds below for more, or just read this piece about recent statements from the Fed Chair, Jerome Powell in the past few days) that this represents a significant risk to our portfolios.
We are preparing to make significant changes to our portfolios across the board in anticipation of another 20% or more drop in the markets. We have been on the phone constantly for the past few weeks talking with clients about this possibility, and encourage you to call if you would like to discuss the specific changes to your accounts. See below for our proposed changes, and understand that the trades in your account can differ significantly from what we’re presenting below if we’ve customized your accounts.

Before we get to the analysis and model updates, we wanted to give you some GOOD NEWS to read: our 2022 Impact Report. This report was a labor of love, and we’ve poured a lot of ourselves into it, as we wanted to provide Clarity to our clients about what we do, Define our Objectives and Expectations, integrate Perspectives from various stakeholders, provide Transparency about how we run our business, and capture the Lessons we’ve learned along the way.
Since it’s been 4 years since our last impact report, there’s a LOT to cover, and the report ended up being longer than we’d initially expected. To make it easier to find the sections you’re interested in reading, the table of contents on page 4 is clickable, so feel free to click on the section headings you’d like to read and the document will take you there. Click the button to the left to download it, and please let us know what you think! This was written for you, our clients, and your feedback will help us set the direction we’re heading in and choose how to spend our time and energy as we move forward. Thank you so much for being with us on this journey – we look forward to continuing to produce these in the future!
Stats & Charts for Nerds
Deeper analysis – click into the sections you’d like to go deeper on here.
Inflation
It’s hard to find articles that JUST talk about inflation, since most of the ones we’re reading bridge this topic into a discussion of interest rates, like this one. We really like to present raw data with some context here, so take a look at this long term chart of how quickly prices have risen year-over-year going back to 1950. We had to go back that far to find a similar peak, and it’s well worth noting that the last time the country saw inflation like this was in the 70’s and 80’s.
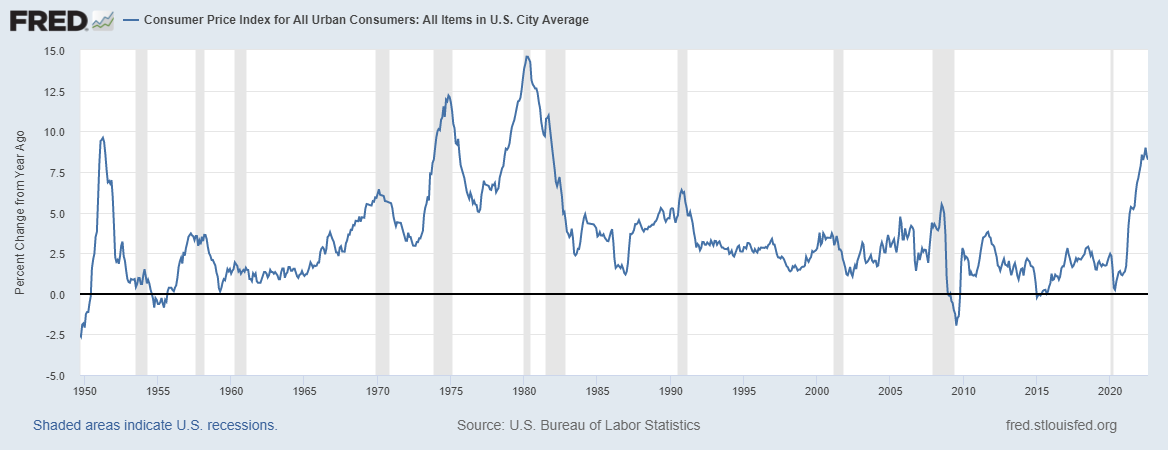
It’s worth blowing up the recent few years as well for one reason – all indications are that the Fed will continue an extremely aggressive interest rate increasing program (more on that in the next section), but we’ve already seen what Bob and Max think is the peak of the recent bout of inflation. We could certainly be wrong about that – this data is rather noisy, and there are external factors including the end of the recent drop in gas prices and increases in bread prices in Europe due to the continued conflict in Ukraine.
The purpose of this section is simply to present some data – in the next section, we’ll talk about interest rates, and then we’ll put everything together near the end. If you’d like to read more, the consulting firm McKinsey & Company puts out an excellent deep dive on how inflation has impacted consumer behavior recently.
Interest Rates & The Fed’s Balance Sheet
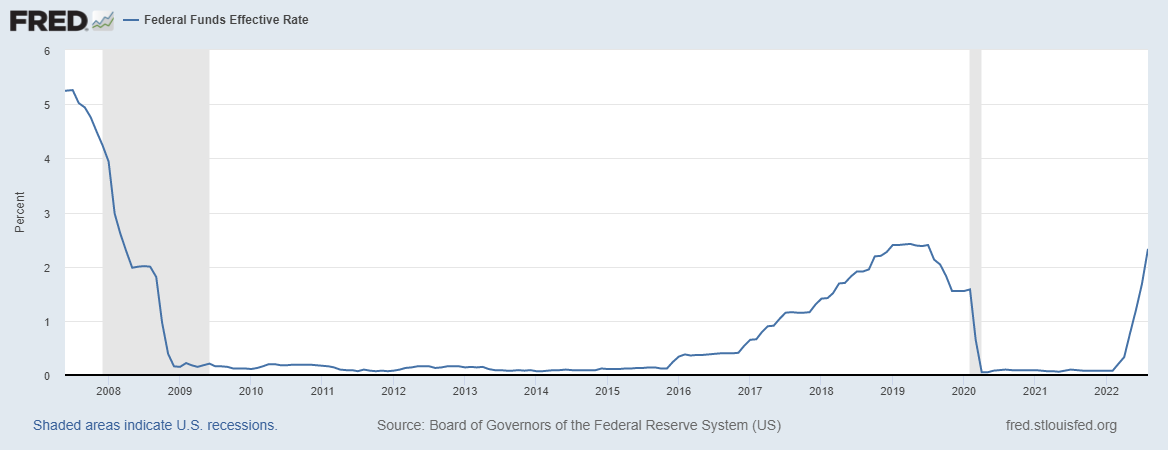
Here are the two charts that have been driving the markets recently – the first looks at the Federal Funds Effective Rate since the Fed lowered interest rates to effectively zero in the wake of the 2008 financial crisis:
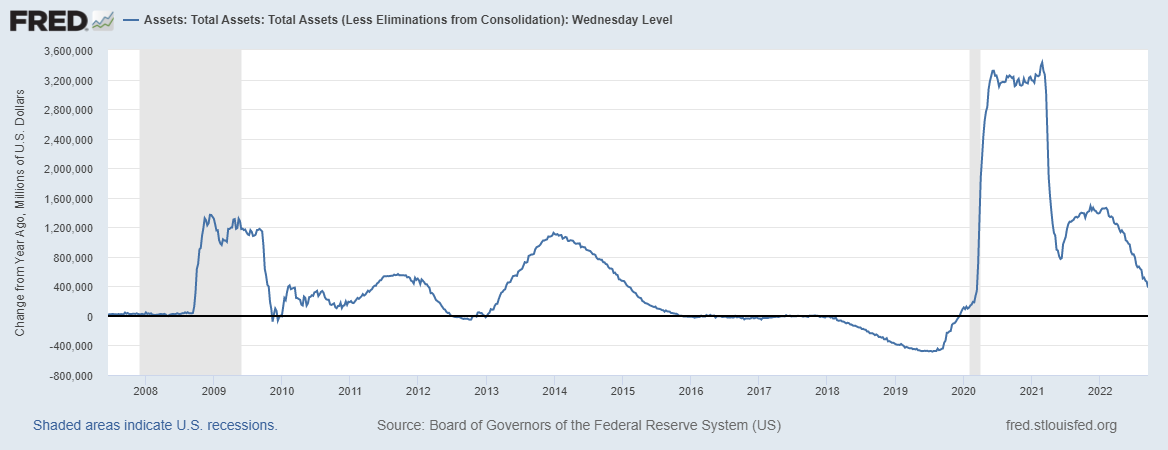
The second chart, below, looks at the Fed’s balance sheet, or the assets that the Fed has purchased in order to provide Liquidity to the financial system (click here for a great article on Liquidity, how to understand it and what it means) – to make this easier to read, the chart below shows the change in the Fed’s balance sheet from a year ago, not the absolute level of assets the Fed owned at any one time – an upward trending line means that the fed was increasing the balance sheet and providing liquidity to the markets, while a downward trendline means that the fed was either letting the bonds they owned at the time mature, decreasing the balance sheet slowly, or selling assets, resulting in a much steeper downward slope.
Take a look at those two charts, along with the one below, that looks at the S&P 500 from 2016-July of 2019. While the Fed had started to raise rates in 2016 and really in 2017, it wasn’t until the Fed started to reduce its’ balance sheet in 2018 that we saw a ‘taper tantrum’ in the markets. you can see a clear spike in volatility and drops in the markets in early 2018 and again in October of 2018, and a clear reversal of both the Fed’s balance sheet trends and interest rates in response.
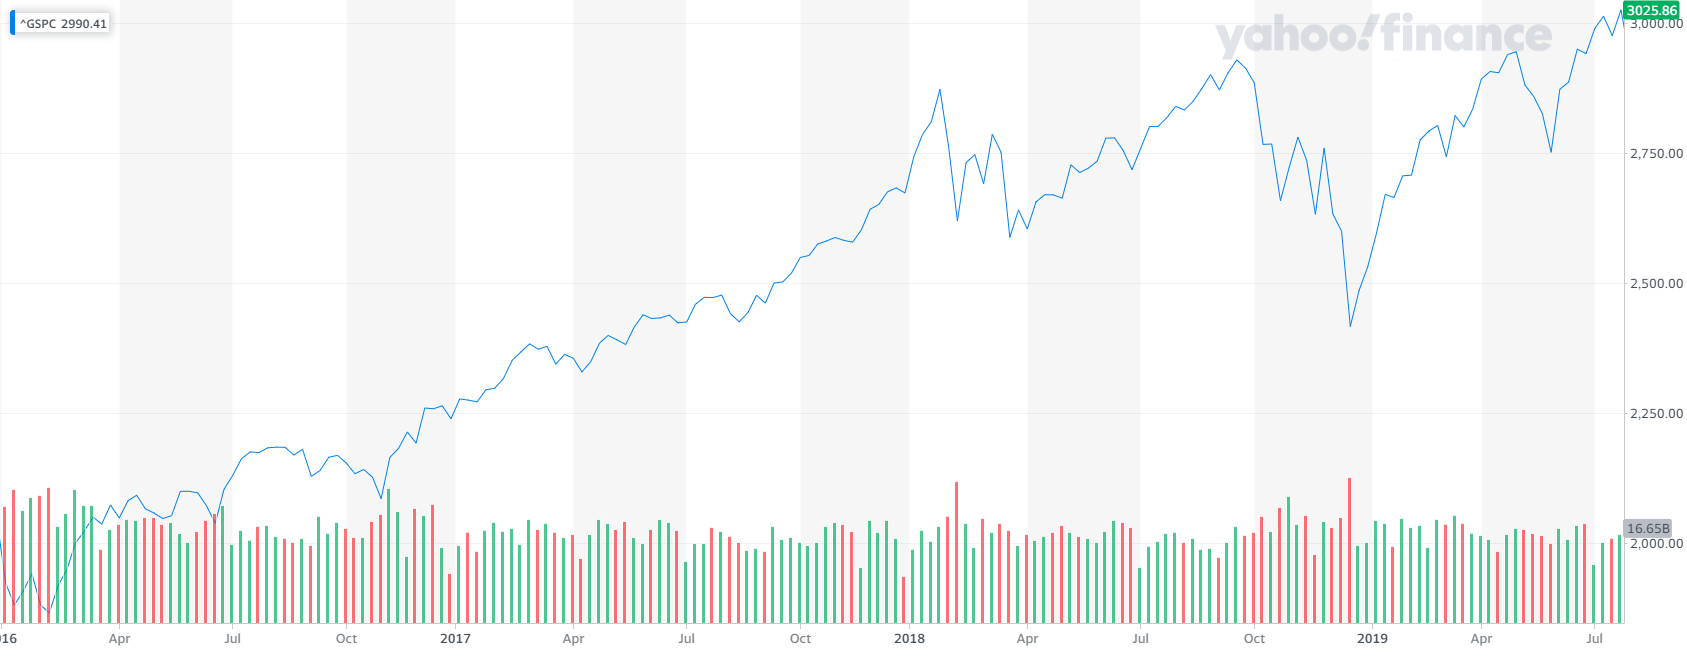 That drop in the S&P ar the end of 2018 was about 16%, from the peak at the beginning of October to the reversal which came on Christmas day when the Fed reversed course on monetary policy. That’s basically in line with what we saw at the beginning of 2022, when the S&P was down about 18%.
Putting Everything Together with more complex charts
We warned you – this is where all of these charts come together. First, look at this long term chart, that has the Fed Funds rate in Red, with CPI, a measure of inflation, in blue. Notice how the two charts move in tandem, but there tends to be a few months lag between a move in interest rates and a decrease in inflation. 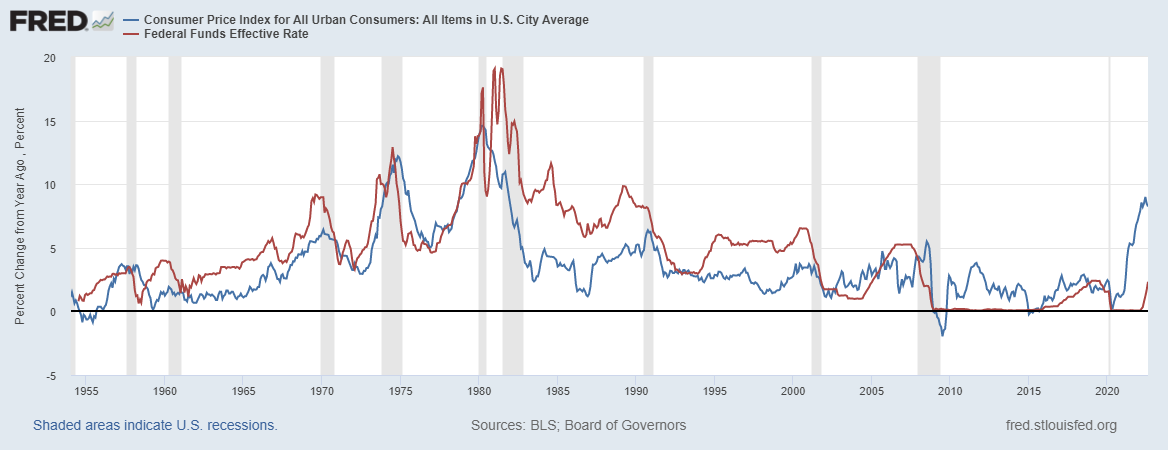
The correlation between those two lines is, in our opinion, pretty strong. Pay special attention to the patterns in the 1970s and 1980s – there is strong evidence of political manipulation of the money supply at that time to boost the economy, which ended up causing the inflation spikes that resulted in Paul Volker, the chair of the Fed at the time, raising rates so high that they eventually caused deep and severe recessions. Politico had a great article on this – read this if you’d like to learn more.
The question at this point is: Are we in the same situation as we were in the 70’s? The Fed appears to be following the same playbook that Volker used to crush inflation in the 70s, with historically large increases in interest rates, but Powell’s messaging in the lead up to the interest rate increase on 9/21/22 and congressional testimony from leaders in the financial services industry on the same day that rates were raised contain a common thread. It’s too early to tell what impact the interest rate increases have had on the economy.
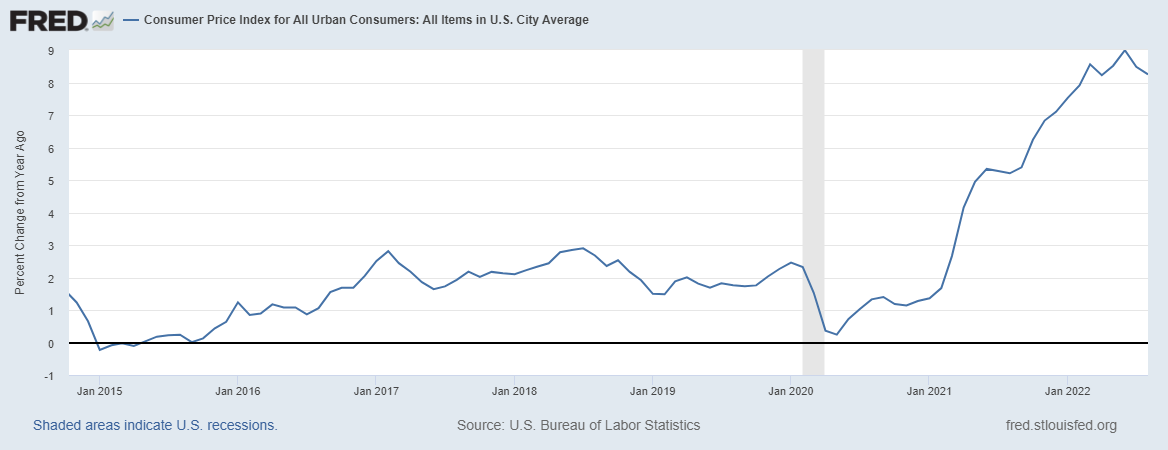
Here’s the thing about that statement (and this is the critical part that we’ve been building to here): if it’s too early for us to have seen the impact of the interest rate increases, why does inflation appear to have peaked in the short term, and what’s going to happen to the economy and the markets once we DO start to feel the impact of these changes? Take a look at this chart, which expands the last few years of the chart above so you can zoom in on the recent past:
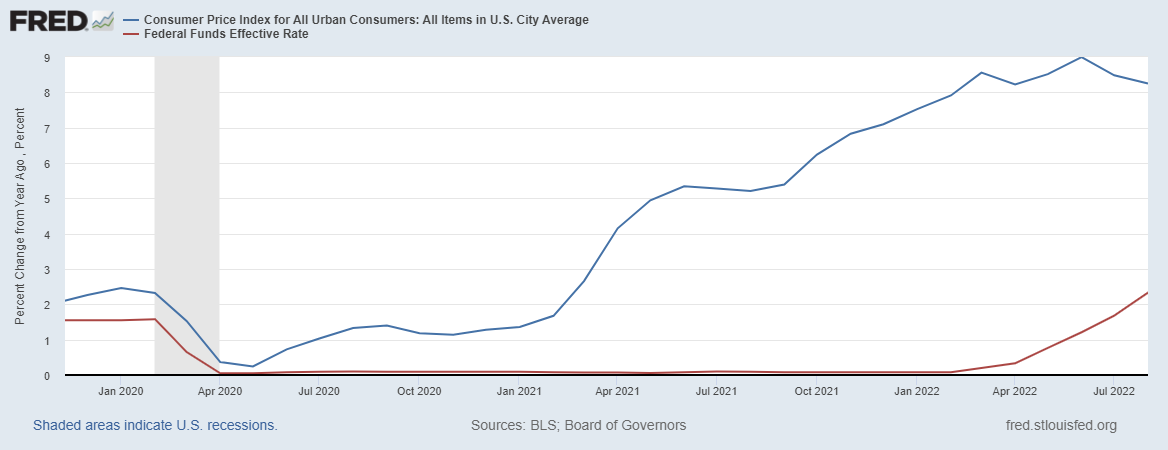
We were, and remain, firmly in ‘team transitory’, the group of economists, financial advisors, and other professionals who believe that the recent bout of inflation is the result of the massive amount of money that was printed in the past few years as a result of the pandemic. We still believe this, and the logic that led us to this point now leads us to another conclusion – that the Fed is raising rates too quickly, coupled with tightening liquidity in the system and is not waiting to see the impact of this change in monetary policy on the economy and markets. It looks to us like the Fed is going to continue an aggressive interest rate increasing program while also aggressively decreasing its’ balance sheet at the same time that the global economy is slowing down. We think this is setting up another big drawdown in the markets, both in stocks and in bonds as we saw earlier this year. We’ll be adjusting our portfolios accordingly, using one security that’s benefited from the increase in interest rates: T Bills.
Recession?
In our last market update, we used the phrase “there is a non-zero chance of a recession in the next 18 months” – based on the analysis in the last sections (which you should read if you’ve gotten this far and haven’t already), we now expect a recession to occur in the next year. There are a few outstanding questions:
- Are we going to be right about this call?
- If we are right, will we see a mild recession (what the Fed refers to as a “soft landing) or a more severe one like what happened in the 70s?
On the balance, we now believe that the risks outweigh the potential benefits. We strongly encourage you to review the changes we’ll be making to our model portfolios and call us with questions or if you’d like to talk.
A Note on our process
We do not take changes like what you’re about to see lightly. Over the past week, Bob and Max have done a deep dive into the portfolios, looking at the funds in each portfolio from a few perspectives – Tax consequences for selling things in taxable accounts, what types of assets each fund owns and how it’s done recently, both in terms of raw performance and compared to other funds in their peer groups.
These changes represent a balancing act – we don’t love selling assets at a loss, but those assets which are down significantly this year tend to also be the same assets which are most likely to continue dropping if the Fed continues to raise rates too aggressively, or if we see a deep and lasting recession.
As such, we are following a slightly different strategy for each model portfolio, based on the aggregate risk tolerances of the clients invested in each model.
If you would like to revisit your risk tolerance or discuss these changes with us, please do not hesitate to call.
A Comment on the Shelton Green Alpha Fund (NEXTX)
The sponsor’s recent behavior necessitates selling the fund
This note is independent of the other things discussed in this update, but it’s important enough to warrant its’ own section. We recently became aware of an update to the prospectus of the Shelton Green Alpha Fund (NEXTX) (click here to see it) that caused deep concern. As you’ll see if you look at the Prospectus, 2 new supplements have been added to the prospectus that inform investors that Shelton Capital, the advisor to the fund, has informed the sub-advisor to the fund, Green Alpha Advisors, that they will no longer be managing the fund. The second supplement informs investors that Green Alpha Advisors can be removed from the fund with 10 days notice, and will continue to serve indefinitely, under the sword of damocles. We met the portfolio managers of this fund, Garvin Jabusch and Jeremy Deems, many years ago, and have followed their work closely as early investors in the fund. Our faith in these managers and their strategy paid off well, delivering good results for years, and spectacular results in 2020, when the fund was up a truly impressive 113.87%.
We remain confident in this management team, and are excited to look at the new ETF they’re launching, the AXS Green Alpha ETF (NXTE). We anticipate adding this ETF into our higher risk portfolios to continue this strategy’s place in our portfolios, but given market conditions, we’re going to be moving this portion of the portfolios to cash/short duration treasuries to keep some ‘dry powder’ as we wait for a more favorable entry point on this fund. Given the uncertainty regarding the future of NEXTX and the fact that as of this writing, we have received exactly NO communications from Shelton Capital regarding this transition, their current or future plans for the fund, or the reason for the parting of ways despite the impressive performance of the fund, we feel that we have no choice but to sell the position, which is held only in our Aggressive and Moderate Aggressive portfolios. Please call us if you’d like to discuss this or retain the position in your accounts.
Portfolio Changes
Please note – we are making significant revisions to the portfolios this quarter in preparation for another drop in the markets.
Please click the buttons below to see the changes to each model, or click into the areas below for more information and a rationale for the changes.
On the last page of each report is an “Action Plan” that shows our Buy, Hold and Sell recommendations.
In addition to these changes, we will rebalance all accounts to bring them into alignment with the models.
All model portfolios are presented at a $100,000 value, & all performance numbers are quoted net of a 1% management fee.
We intend to implement these changes within the next week. Please call us with questions